‏إظهار الرسائل ذات التسميات Nuclear Medicine. إظهار كافة الرسائل

Infosys Science Foundation Announces the Infosys Prize 2023 in 6 Categories

Infosys Science Foundation Announces the Infosys Prize 2023 in 6 Categories

Six individuals awarded for their remarkable contributions to scientific research in India

Infosys Science Foundation (ISF) today announced the winners of the Infosys Prize 2023 in six categories – Engineering and Computer Science, Humanities, Life Sciences, Mathematical Sciences, Physical Sciences, and Social Sciences. Since its inception in 2008, the Infosys Prize has honored the accomplishments of the recipients and awarded them for their contributions to scientific research and scholarship impacting India. The prize for each category comprises a gold medal, a citation, and a prize purse of USD 100,000 (or its equivalent in INR). The event was hosted at Infosys Science Foundation’s office in Bengaluru.

The laureates of Infosys Prize 2023 were shortlisted from 224 nominations by an international panel of jurors comprising world-renowned scholars and experts. Over the past 15 years, ISF has recognized some of the best groundbreaking research and scholarship that has contributed to every aspect of human life. The Infosys Prize is currently the largest award in India that recognizes excellence in science and research.

Infosys Prize laureates have gone on to win many international accolades. These include the Nobel Prize (Abhijit Banerjee and Esther Duflo), the Fields medal (Manjul Bhargava and Akshay Venkatesh), the Dan David Prize (Sanjay Subrahmanyam), the MacArthur ‘genius’ Grant (Sunil Amrith), and the Breakthrough Prize in Fundamental Physics (Ashoke Sen). Several laureates have been elected fellows of the Royal Society, among them Gagandeep Kang, who became the first Indian woman to be elected Fellow of the Royal Society. Others have gone on to hold influential posts in government and academia.

The winners of the Infosys Prize 2023 were announced by the trustees of Infosys Science Foundation – Mr. Kris Gopalakrishnan (President, Board of Trustees), Mr. Narayana Murthy, Mr. Srinath Batni, Mr. K. Dinesh, and Mr. S. D. Shibulal. The other trustees of Infosys Science Foundation – Mr. Nandan Nilekani, Mr. Mohandas Pai, and Mr. Salil Parekh – extended their felicitations.

Kris Gopalakrishnan, President – Infosys Science Foundation, said, “This year marks a landmark moment in Infosys Science Foundation’s journey. Over the course of 15 years, the Infosys Prize has recognized mid-career researchers who have done impactful, groundbreaking work across disciplines. The prize has helped drive conversations around their work and on a larger scale created meaningful engagement around science and society. I congratulate the winners of the Infosys Prize 2023.”

Sharing his thoughts, Narayana Murthy, Founder – Infosys, Trustee – Infosys Science Foundation, said, “Learnability, creativity and innovation are the ways to navigate our fast-changing world. We must be daringly inventive to tackle the daunting and persistent problems of today. The laureates of the Infosys Prize have shown us the importance of this adaptive thinking through their approach to problem solving – be it for centuries old conjectures in mathematics, translational medicine and diagnostics or finding solutions to societal challenges like poverty. For this I congratulate all the winners of the Infosys Prize and those who have won in 2023.”

Winners of the Infosys Prize 2023 in the six categories are:

Engineering and Computer Science

The Infosys Prize 2023 in Engineering and Computer Science is awarded to Sachchida Nand Tripathi, Professor, Sustainable Energy Engineering (SEE), IIT-Kanpur, for the deployment of large-scale sensor-based air quality network and mobile laboratory for hyper local measurements of pollution, data generation and analysis using artificial intelligence and machine learning for effective air quality management and citizens awareness. Prof. Tripathi’s work has shown that the important differences between observations of winter haze formation in Delhi and those in other places like Beijing are that the nano-particle growth-rate in Delhi is much higher and happens at night without photochemistry. This finding holds the key to mitigating air pollution in India.

Humanities

The Infosys Prize 2023 in Humanities is awarded to Jahnavi Phalkey, Founding Director, Science Gallery Bengaluru, for her brilliant and granular insights into the individual, institutional, and material histories of scientific research in modern India. Her book, The Atomic State, and many articles insightfully braid the global history of science, especially nuclear science, with the anthropology of the postcolonial state to illuminate rich and textured histories of the everyday lives of science in India. Dr. Phalkey’s work has emphasized the need to see the history of science as much as a history of scientific ideas, as one of power, practice, and the nation-state.

Life Sciences

The Infosys Prize 2023 in Life Sciences is awarded to Arun Kumar Shukla, Professor, Biological Sciences and Bioengineering, IIT-Kanpur, for his outstanding and far-reaching contributions to the field of G-protein coupled receptor (GPCR) biology. Prof. Shukla’s research has established a new understanding of GPCRs, which are one of the most important classes of drug targets. His work has opened up previously uncharted avenues for designing novel and effective therapeutics.

Mathematical Sciences

The Infosys Prize 2023 in Mathematical Sciences is awarded to Bhargav Bhatt, Fernholz Joint Professor at the Institute for Advanced Study and Princeton University, for his outstanding and fundamental contributions to arithmetic geometry and commutative algebra. Prof. Bhatt’s joint work in prismatic cohomology with German mathematician Peter Scholze introduces new ideas and powerful methods in this area at the heart of pure mathematics.

Physical Sciences

The Infosys Prize 2023 in Physical Sciences is awarded to Mukund Thattai, Professor, Biochemistry, Biophysics and Bioinformatics, National Centre for Biological Sciences, in recognition of his groundbreaking contributions to evolutionary cell biology. Prof. Thattai is a physicist who researches how complex cellular organization emerged from microscopic disorder. Thattai’s work could have profound implications in one of biology’s central mysteries of how complex cells emerged from primordial ones. He is among the pioneers of the physics of life.

Social Sciences

The Infosys Prize 2023 in Social Sciences is awarded to Karuna Mantena, Professor, Political Science, Columbia University for her groundbreaking research on the theory of imperial rule, and the claim that this late imperial ideology became one of the important factors in the emergence of modern social theory. Prof. Mantena’s book Alibis of Empire and related papers are landmark publications in political theory with implications for all social sciences. Her impactful book helps us understand that the dramatic shift in imperial policy, following the 1857 rebellion in India was not a straightforward reaction to this traumatic event but legitimated by a new ideology of indirect imperial rule that was carefully crafted by the ingenious conceptual work of thinker-administrators such as Henry Maine. 

Morgan Stanley PE Acquires Gurugram based Clearmedi Healthcare, A Cancer Care Hospitals Chain for $35 Mn


Morgan Stanley’s private equity arm has acquired a majority stake in Gurugram-based oncology/cancer care hospital chain, for reportedly $35 Million.

ClearMedi Healthcare is a joint venture between Medipass (La Repubblica group) S.r.l. Italy, KOS S.p.A. Italy and Clearview Healthcare India.

Morgan Stanley PE, along with the promoters of the healthcare chain, bought out 100% stake in the healthcare chain from Italy's KOS Group.

The acquisition deal includes both stake purchase and infusion of fresh equity into the company, said a report by Economic Times. However, specific details like proportion of stakes picked from the KOS Group and how much came into the company as fresh equity remain undisclosed at present.

Founded in 2010, by Shashi Kant Baliyan, ClearMedi is in business of managing complex clinical services running and operating full clinical setups/ Hospitals. From unit operations of Oncology, Nuclear Medicine and Radiology, we are now Operating and Managing stand-alone Super Specialty Hospitals.

The hospital chain has over 350+ Hospital beds autonomously managed by it in different self-sufficient Tertiary-care Hospitals fully managed by ClearMedi.


XINGIMAGING and MITRO BIOTECH CO., LTD. to DELIVER FULL-SERVICE CRO OPERATIONS TO CHINA

NEW HAVEN, Conn., Dec. 15, 2022 /PRNewswire/ -- XINGIMAGING, LLC, and MITRO Biotech Co., Ltd. each highly recognized for drug development and imaging solutions, announce today that they will join forces to provide comprehensive contract research services in China. The company will be a leading partner to global pharmaceutical and biotechnology companies working in China and will expand its capabilities and scope in neuroscience and oncology. "XingImaging is unique with its strong network of PET centers providing industry partners access to the most advanced neuroimaging tracer compounds available, and I am excited to have our combined organizations offer a full spectrum of imaging research services not previously available in China," said Haowei Wu, MITRO Biotech CEO. "It's a perfect union of two companies working together to accelerate development of new drugs from nuclear medicine drug discovery through all phases of clinical research in China." Founded in 2012, MITRO Biotech Co., Ltd. was the first company in China to provide pre-clinical and clinical contract research services by applying molecular imaging technologies. "Our organizations have worked side-by-side for more than a decade," said Wu. "Our relationship is enriched by the combined experience and skills each organization brings to the table. As a united force, we will work together to solve the rapidly developing requirement to introduce PET imaging to clinical research trials in China." Referring to this transaction, XingImaging Co-Founder and CEO Dr. Gilles Tamagnan said: "it's an enormous opportunity to further our commitment to patients in China by providing access to clinical imaging as an essential component for evaluating novel investigational therapeutics. This union represents the beginning of an even larger strategy to expand these services in China and beyond." Xing Imaging's co-founders and company leaders bring an average of more than twenty-five years of experience to the combined team. Drs. Piu Chan and Kenneth Marek, pioneers in neurological medicine and imaging science, will remain as senior advisors, and Dr. Gilles Tamagnan will serve as CEO of the combined team. The proposed transaction is subject to customary closing conditions, including approval by regulatory agencies. MITRO and XingImaging expect the transaction to close by mid-2023. Chestnut Partners, Inc. is acting as exclusive financial advisor to XingImaging for this transaction. About XingImaging LLC XingImaging is a widely recognized US based biomarker imaging company leading radiopharmaceutical imaging trials in China. With firmly rooted study teams on the ground in China and the US, XingImaging works in collaboration with biotech and pharmaceutical companies for the testing and advancement of therapeutics through brain imaging. Xing Imaging's world-renown scientific expertise gives it an advantage, opening the way for academic and industry sponsors to conduct cutting edge research in China. With each of the co-founders and company leaders having an average of 25 plus years of experience, this knowledge is one of Xing Imaging's greatest attributes. About MITRO Biotech Co, Ltd. MITRO Biotech Co., Ltd. is a molecular imaging contract research organization (MI-CRO) company in China. MITRO provides outstanding contract research for new drug development using Radiolabeling and Molecular Imaging technique. MITRO provides integrated solutions, including drug screening, biodistribution, pharmacokinetics and pharmacodynamics. MITRO provides the translational research service from nude mice, rats, monkeys to human. MITRO focus on cancer, coronary heart disease, Alzheimer's disease, epilepsy, Parkinson disease, Rheumatoid arthritis, Diabetes, gene expression, stem cell research, etc. View original content:https://www.prnewswire.co.uk/news-releases/xingimaging-and-mitro-biotech-co-ltd-to-deliver-full-service-cro-operations-to-china-301703709.html

The 24th China Hi-Tech Fair Opens on November 15 in Shenzhen, China

https://ift.tt/Pny3CwT

Business Wire India

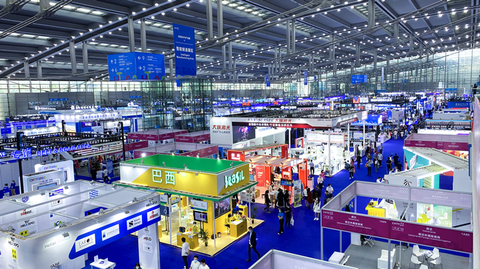
The 24th China Hi-Tech Fair (CHTF 2022) kicked off in Shenzhen on November 15, 2022. Taking place until November 19, this year’s event has been comprehensively upgraded to the largest ever, integrating new product and technology launches, product and solution exhibitions, trade negotiations, and investment finance, across a diverse variety of hi-tech sectors including biomedicine, new materials, modern agriculture, fine chemicals, aerospace, new energy, high-end equipment manufacturing, energy conservation and environmental protection.


This press release features multimedia. View the full release here: https://www.businesswire.com/news/home/20221115006208/en/

 
 International Pavilion and IT Exhibition of CHTF 2022 (Photo: Business Wire)

 International Pavilion and IT Exhibition of CHTF 2022 (Photo: Business Wire)

CHTF 2022 will gather a total of 5,000 exhibitors, including domestic multinationals and industry champions such as China General Nuclear Power Corporation, Huawei, ZTE, and Han’s Laser, along with hi-tech “little giants” such as: Kemai, a digital payment system provider; Keanda, a rail transit products manufacturer; and Insighters, a medical technology startup.


Also participating are overseas exhibitors from 38 countries including Brazil, Canada, Finland and Russia, some of which will join via CHTF 2022’s virtual platform. Among them, the Russian Ministry of Education and Technology and the Bavarian State Government of Germany, two of CHTF’s longstanding cooperation partners, have been sending delegations to CHTF for more than 20 consecutive years.


CHTF 2022 will host the inaugural Water Conservation and Innovation Exhibition, which together with a high-tech talent attraction show and an expo for emergency safety will boost the appeal of the event.


Meanwhile, the CHTF Hi-Tech Forum will be held on November 15-17, with a key focus on the digital economy, metaverse, quantum computing, AI, cloud computing, “lighthouse” factories and smart cities, future mobility, and “dual-carbon” goals. The forum will be livestreamed here.


The X-Lake Forum 2022, as the main side-forum of CHTF 2022, was held on November 15. Focused on “openness, integration and future”, this forum discussed development trends and shared cutting-edge hi-tech innovations. John Lee, Chief Executive of the Hong Kong Special Administrative Region; Ho Iat-seng, Chief Executive of the Macao Special Administrative Region; and Ciyong Zou, Director at UNIDO delivered video speeches. Scholars, academicians and renowned industry leaders including Nobel Laureate Roger D. Kornberg delivered keynote speeches at the forum.


More information is available on https://www.chtf.com/english/


Jinan Has Become a Household Name for Holding the World Advanced Manufacturing Conference Twice

https://ift.tt/XrwLGVf

Business Wire India

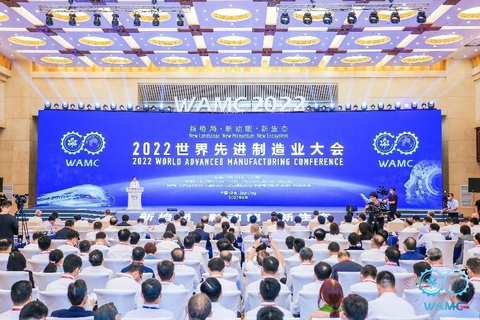
The 2022 World Advanced Manufacturing Conference opened in Jinan, the capital of East China's Shandong province on Aug 31. This is the second time for Jinan to hold the Conference since the first one in 2021.


This press release features multimedia. View the full release here: https://www.businesswire.com/news/home/20221029005015/en/

 
Jinan Has Become a Household Name for Holding the World Advanced Manufacturing Conference Twice (Photo: Business Wire)

Jinan Has Become a Household Name for Holding the World Advanced Manufacturing Conference Twice (Photo: Business Wire)

Guided by the strategic decisions and plans of CPC central committee to make China a manufacturing and network powerhouse, Jinan has fully implemented the strategy of building a strong industrial city and a digital pioneer city, promoted the digital, networked, and intelligent transformation and upgrade of the manufacturing industry, taken the lead in proposing to make Jinan strong in intelligent economy and a digital pioneer city, forming a leading area for the development of advanced manufacturing and the digital economy.


The development of Jinan’s advanced manufacturing and digital economy has made new improvement, and the scale of the four leading pillar industries has exceeded 1.3 trillion RMB. Jinan ranks the 15th in the Top 100 Advanced Manufacturing Cities (2021) List released by CCID Research Institute, and the 6th in the Top 50 Digital Economy City in 2022 released by Deben Consulting, eNet Research Institute and CIWEEK.


Manufacturing in Jinan demonstrates Jinan's powerful strength in advanced manufacturing and the digital economy.


A series of the latest achievements in Jinan's advanced manufacturing and digital economy were exhibited at the innovation achievement exhibition held concurrently with the Conference, including the initiative and world-leading ski waxing truck in Beijing Winter Olympics, and the Joyoung "Space Kitchen" products applied to the Chinese Space Station and Shenzhou spacecraft, demonstrating Jinan's powerful strength as the host.


In the achievement exhibition area of "Strong Industrial City, Intelligent Manufacturing of Jinan," the reporter learned that there were 28 exhibitors from Jinan, accounting for 52% of the total in Shandong province. Moreover, the exhibits also counted for more than half of all. In terms of the exhibits, they included the shield tunneling machine of Jinan Heavy Industry Co., Ltd, the haul truck of LGMG, the childcare detection robot of Synthesis, the chip products of Shandong Huaguang optoelectronics Co., Ltd., “Space Kitchen” small appliances of Joyoung, phenolic hollow microspheres and light-core steel composite materials of Jinan Shengquan Group Share Holding Co., Ltd., semi-insulating silicon carbide substrate materials of SICC Co., Ltd., and the Fluorescent Quantitative Detection System of BIOBASE. All those new, famous and high quality products are concentrated, covering the four leading pillar industries in Jinan.


Jinan’s Manufacturing also appeared in the ten major pilot projects and the signing of key projects released at the Conference. At the main forum held on Aug 31, the ten leading projects of advanced manufacturing were released, including the projects of the stationary fuel cell and air-cooled fuel cell manufacturing base projects of Jinan Lvdong Hydrogen Energy Technology Co., Ltd. and Digital Supply Chain Enabled by JDM Business Model of Inspur Electronic Information Industry Co., Ltd.


In terms of the major projects, the Conference has collected 77 signed projects in total, with the total amount of 66.823 billion RMB. Among them, 16 key cooperation projects were signed at the main forum, covering advanced equipment, new-generation information technology, advanced materials and biomedicine. Jinan “captured” three projects including the intelligent system and robotics technology research center, new energy mining complete equipment digital factory, and the first artificial intelligence industrial park based on deterministic network computing and network integration applications in China.


Leading figures made compliments on this event.


The strategy of building a strong industrial city drives the vigorous development of the advanced manufacturing industry in Jinan.


The shining “Manufacturing of Jinan” displays Jinan’s persistence in the development of advanced manufacturing and its confidence in deepening the growth drivers transformation and taking the advantages of its high-quality development.


In the afternoon of Aug 31, at the High-end Equipment Strong Chain Forum of the Conference, Sun Bin, member of the Standing Committee of CPC Jinan Municipal Committee and Vice Mayor of Jinan, introduced that Jinan was guided by the strategy of building a strong industrial city and making every effort to promote the manufacturing development in a high-end, intelligent, green and low-carbon way. In 2021, Jinan's manufacturing industry counted for more than 90% of the industry, and the advanced manufacturing industry counted for more than 60% of the manufacturing industry. The development of the advanced manufacturing and the digital economy have both entered the forefront of the first-tier cities in China. Among them, the scale of the intelligent manufacturing and the high-end equipment industry has reached 450 billion RMB, and the scale of big data and new-generation information technology industry has reached 500 billion RMB. Heavy Duty commercial vehicles of China National Heavy Duty Truck Group Co., Ltd., the large-scale stamping production lines of Jinan Machine Tool Group Co., Ltd., and large-scale mining trucks of Shandong Lingong Construction Machinery Co., Ltd. all rank in the leading position in the industry. The production and sales volume of Inspur servers rank the 1st in China and 2nd in the world. Known as “the world's largest ring”, IRAETA's super-large integral ring-rolled steel ring has successfully become widely known, representing the highest technical level of nuclear power forgings. We now have cultivated 3,300 specialized enterprises, 85 national-level specialized little giant companies, and 892 gazelle companies.


The participants fully affirmed the strong resilience and vitality of the advanced manufacturing industry in Shandong Province, especially Jinan.


Zhou Ji, academician of the Chinese Academy of Engineering and director of the National Manufacturing Strategy Advisory Committee, took Inspur Group as an example. He pointed out that in the process of making China a world manufacturing powerhouse, a large number of demonstration, benchmarking and lighthouse factories had emerged in China for the construction of digital and networked factories. These enterprises have become world-class and set demonstrations and examples for China's manufacturing industry regarding digital and networked transformation and upgrade, for example, Inspur Group is a demonstration factory for digital and networked manufacturing in the field of information equipment.


Ma Yaqing, chairperson of CCID Consulting Co., Ltd., said that Jinan, as an important industrial base in Shandong Province, had always been at the forefront of China in the development of advanced manufacturing. In recent years, guided by the strategy of building a strong industrial city and the digital economy, it has continued to expand institutional innovation. With all those efforts, the scale efficiency, innovation capability, market vitality and development quality of advanced manufacturing have been continuously improved.


The development of Shandong province and the changes of Jinan are obvious to all. Now Jinan is promoting the expansion of cooperation with Japan to a deeper level. We hope to give full play to the advantages of Japan and China to achieve more cooperation and breakthroughs in the field of advanced manufacturing, according to Hideo Kawabuchi, counselor of Embassy of Japan in China.


Advanced manufacturing is a promising prospect to strengthen Jinan’s economy and become a digital pioneer city.


Yu Haitian, Vice Party Secretary of CPC Jinan Municipal Committee and Mayor of Jinan, released the 2022 World Advanced Manufacturing Conference Jinan Declaration. Experts from home and abroad including Zhou Ji, academician of the Chinese Academy of Engineering and director of the National Manufacturing Strategy Advisory Committee, Xie Yi, academician of the Chinese Academy of Sciences and academician of the Academy of Sciences for the Developing World, and Huang Wei, academician of the Chinese Academy of Sciences and foreign academician of the Russian Academy of Sciences have witnessed.


The Declaration proposes that advanced manufacturing is the main front of the new round of scientific and technological revolution and industrial transformation, the main engine and ballast leading the global economic growth, and the key force to improve the well-being of people of the world. At present, a new type of industrialization represented by intelligent manufacturing is in the ascendant. The technological innovation is significantly accelerated, the real economy is accelerating its transformation and upgrade to being digital, networked and intelligent, and the development of advanced manufacturing is standing in the new era and facing new major opportunities.


The Declaration highlights the optimization and upgrade of the manufacturing industry, the development of the digital economy and measures in favor of the real economy, fosters three growth drivers including the innovation, projects and policies, and promotes the advanced manufacturing development in an innovative, pioneering and leading way. To this end, the Declaration proposes four major initiatives: adhere to innovation-driven development and strengthen new growth drivers of high quality development; adhere to integration and empowerment and embrace the digital economy; adhere to green and low-carbon development and explore new paths for transformation and upgrade; adhere to openness and cooperation and build a new model of integrated development pattern.


In recent years, Jinan Municipal Bureau of Industry and Information Technology has focused on promoting the first-class industry and information development, continuously implementing the spirit of "future-oriented goals, advanced planning, efficient work and innovative development," exploring the innovative development path as mentioned in the Declaration for the industrial and information technology, and integrating industry, policy and service. Building a first-class industrial, policy and service system has stimulated the vitality of the market and the internal growth momentum of the enterprises, and thus Jinan has achieved good results in just three years.


The Conference aims to promote the international division of work and cooperation on industrial chain and supply chain under global vision, build platform for manufacturing high-quality development exchanges, reach consensus on high-quality development of manufacturing and provide new growth drivers and projects, together with enhancing the continuous innovation in technology, products, business modes and patterns. The industrial upgrade will eventually be achieved through the innovation. The successful conference in Jinan, in particular, the release of the Declaration undoubtedly bears far-reaching significance.


Looking into the future, Jinan enjoys the three integrated national strategies of Ecological Protection and High Quality Development of Yellow River, the Start-up Area for Growth Drivers Transformation and China (Shandong) Pilot Free Trade Zone, and the development prospect of Jinan's advanced manufacturing industry is promising. According to Ji Peide, director of Jinan Municipal Bureau of Industry and Information Technology, Jinan will hold the World Advanced Manufacturing Conference in the future. The logo of the conference is two coupling gears, representing the dual-wheel drive that will lead the manufacturing into the broad prospects. We firmly believe that the intelligent manufacturing will be the main direction of the future manufacturing industry in Jinan, and Jinan will be strong in intelligent economy and a digital pioneer city.


Dassault Systèmes Delivers Solid Third Quarter Driven By Accelerating Recurring Revenue Growth, Reaffirms 2022 Objectives

Press Release

VELIZY-VILLACOUBLAY, FranceOctober 26, 2022

Dassault Systèmes Delivers Solid Third Quarter Driven By Accelerating Recurring Revenue Growth, Reaffirms 2022 Objectives

Dassault Systèmes (Euronext Paris: FR0014003TT8, DSY.PA), today announced IFRS unaudited financial results for the third quarter and nine months ended September 30, 2022. The Group’s Board of Directors approved these results on October 25, 2022. This press release also includes financial information on a non-IFRS basis and reconciliations with IFRS figures in the Appendix to this communication.

Summary Highlights  

(unaudited, all revenue growth rates in constant currencies)

  • 3Q22 IFRS diluted EPS increased 20% to €0.16 as reported. Non-IFRS diluted EPS grew 17% to €0.26 as reported, outperforming our objectives.
  • 3Q22 total revenue and software revenue increased 8% (IFRS and non-IFRS), driven by strong subscription & support revenue growth of 10% (IFRS and non-IFRS). Licenses & other software revenue declined (2)% (IFRS and non-IFRS) due to our focus on increasing the mix of subscription versus license revenue
  • 3Q22 3DEXPERIENCE software revenue rose 15% (IFRS and non-IFRS). Cloud software revenue increased 21% (IFRS and non-IFRS).
  • FY2022 non-IFRS objectives: reaffirming total revenue growth of 9%-10%, in constant currencies. Raising non-IFRS diluted EPS target to 18%-19% growth to €1.12-€1.14, and on track to be fully deleveraged by year-end.

Bernard Charlès, Dassault Systèmes’ Vice Chairman of the Board and Chief Executive Officer commented:

“Virtualization is about applying science at scale, using the virtual world to extend and improve the real world. For forty years, we have been a trusted partner, leveraging science, to help clients overcome their most significant challenges, prepare for the future, and realize their greatest ambitions - from agility and resiliency to sustainability. Today, clients across all sectors, and society at large, face a complex and rapidly changing business environment. The role we play is as critical as ever; this was well demonstrated at our recent customer forums, held around the world. Virtualization opens possibilities well beyond digitization - it's the next frontier.

Our foundation in science is truly a differentiator. Our virtual twin experiences, powered by cloud-based 3DEXPERIENCE, are not simple renderings, they are fully integrated with scientific laws and principles and all of our technologies. Incorporating multi-physics, multiscale and multi-discipline, we combine modeling, simulation and data science for a holistic approach to innovation and business optimization. We empower our clients to create virtual universes to operate the lifecycle of their products and also the production systems. This establishes a valuable foundation to fully leverage the future of data science.

As data collection and analysis accelerate, virtualization of society and the economy requires the highest levels of security, trust and services. For these reasons, we announced our new strategic objective to elevate 3DS OUTSCALE, Dassault Systèmes' sovereign cloud infrastructure, to a brand, protecting environments for creating and operating sustainable virtual twin experiences. Trust is a topic of the greatest importance for all of society – consumers, patients and citizens.”

Financial Summary

In millions of Euros,
except per share data and percentages

  IFRS   IFRS
  Q3 2022 Q3 2021 Change Change in constant currencies   YTD 2022 YTD 2021 Change Change in constant currencies
Total Revenue   1,373.0 1,158.7 18% 8%   4,081.4 3,492.4 17% 9%
Software Revenue   1,229.8 1,044.6 18% 8%   3,685.4 3,163.1 17% 9%
Operating Margin   19.3% 20.5% (1.2)pt     22.3% 20.1% +2.2pts  
Diluted EPS *   0.16 0.14 20%     0.46 0.41 12%  


In millions of Euros,
except per share data and percentages

  Non-IFRS   Non-IFRS
  Q3 2022 Q3 2021 Change Change in constant currencies   YTD 2022 YTD 2021 Change Change in constant currencies
Total Revenue   1,373.0 1,158.8 18% 8%   4,081.6 3,493.9 17% 9%
Software Revenue   1,229.9 1,044.7 18% 8%   3,685.6 3,164.4 16% 9%
Operating Margin   31.6% 33.8% (2.3)pts     32.8% 33.3% (0.5)pt  
Diluted EPS *   0.26 0.22 17% 6%   0.80 0.67 19% 11%

* 2021 and 2022 figures have been presented in order to reflect the five-for-one share split of Dassault Systèmes’ share effected on July 7, 2021

Third Quarter 2022 Versus 2021 Financial Comparisons

(unaudited, all revenue growth rates in constant currencies)

  • Total Revenue: Total revenue grew 8%, IFRS and non-IFRS, to €1.37 billion. IFRS and non-IFRS software revenue increased 8%, to €1.23 billion. IFRS and non-IFRS subscription & support revenue rose 10%; recurring revenue represented 82% of total software revenue. Licenses and other software revenue decreased 2%, IFRS and non-IFRS, to € 221.3 million. Our focus on accelerating recurring revenue growth drove a higher than expected mix of subscription versus the license model, this quarter. Services revenue increased 16%, IFRS and non-IFRS.

  • Software Revenue by Geography (IFRS and non-IFRS): The Americas revenue grew 7% to 41% of software revenue, driven by strong performance in Life Sciences and High-Tech. Europe demonstrated resiliency in a challenging environment; revenue increased 9% to 34% of software revenue. The region benefited from strength in France, Northern Europe and Southern Europe and from good performance in Transportation and Mobility, from an industry perspective. Asia Pacific rose 6% this quarter to 24% of software revenue, driven by double-digit growth in India and Korea. China was up mid-single digits as Covid-19 related shutdowns continued to weigh on activity.

  • Software Revenue by Product Line:

    • Industrial Innovation IFRS and non-IFRS software revenue rose 6% to €623.5 million, representing 51% of software revenue. CATIA exhibited continued strong momentum with revenue up double-digits. Cyber-Systems delivered excellent performance again this quarter. ENOVIA and DELMIA also showed strong growth during the period.

    • Life Sciences software revenue rose 14% IFRS and 13% on a non-IFRS basis, to €294.6 million, representing 24% of software revenue. MEDIDATA continued to deliver strong performance driven by broad-based growth across product lines and end-markets. Life sciences companies are prioritizing R&D investments and with a renewed focus on value; MEDIDATA is mission critical to accelerate innovation, increase efficiency, reduce costs and to gain a competitive edge.

    • Mainstream Innovation software revenue was €311.7 million on an IFRS and non-IFRS basis, an increase of 5%, and representing 25% of software revenue. Mainstream Innovation was impacted by complex macroeconomic conditions. China’s COVID related lockdowns were also a headwind, impacting SOLIDWORKS performance this quarter.

  • Software Revenue by Industries: Life Sciences & Healthcare, Transportation & Mobility, High-Tech displayed some of the strongest performance.

  • Key Strategic Drivers (IFRS and non-IFRS): 3DEXPERIENCE revenue increased 15% and represented 32% of software revenue. Cloud software revenue grew 21% and represented 24% of software revenue. 3DEXPERIENCE and cloud afford opportunities to deliver incremental value to our customers. As clients embrace a platform approach via the cloud, they are adding new users and new usages, capitalizing on the benefits of adopting all of Dassault Systèmes’ domains.

  • Operating Income and Margin: IFRS operating income increased 12%, as reported. Non-IFRS operating income rose 11% to €433.5 million, as reported. The IFRS operating margin was 19.3% compared to 20.5% in the third quarter of 2021. The non-IFRS operating margin was 31.6%, versus 33.8% for the comparable period last year. Consistent with the plan we communicated early this year, and our long-term focus, we invested in future growth initiatives.

  • Earnings per Share: IFRS diluted EPS increased 20% to €0.16 as reported. Non-IFRS diluted EPS grew 17% to €0.26 as reported.

Year-To-Date 2022 Versus 2021 Financial Comparisons

(unaudited, all revenue growth rates in constant currencies)

  • Total Revenue: Total revenue grew 9% IFRS and non-IFRS to € 4.08 billion. IFRS and non-IFRS software revenue increased 9% to €3.69 billion. IFRS and non-IFRS subscription and support revenue rose 9% to €2.96 billion; recurring revenue represented 80% of total software revenue. Licenses and other software revenue increased 7% IFRS and non-IFRS to €727.5 million. Services revenue rose 13% on an IFRS and non-IFRS basis.

  • Software Revenue by Geography (IFRS and non-IFRS): The Americas grew 8% and represented 40% of software revenue. Europe rose 9% to 35% of software revenue. Asia Pacific increased 11% to 25% of software revenue.

  • Software Revenue by Product Line:

    • Industrial Innovation IFRS and non-IFRS software revenue rose 7% to €1.94 billion and represented 53% of software revenue. Year-to-date, CATIA, ENOVIA and DELMIA exhibited some of the strongest performance.

    • Life Sciences software revenue increased 14% IFRS and 13% to €823.8 million on a non-IFRS basis, representing 22% of software revenue. Excellent MEDIDATA performance has been the key driver of Life Sciences growth.

    • Mainstream Innovation software revenue increased 8% on an IFRS and non-IFRS basis, to €921.5 million IFRS and €921.7 million non-IFRS. Mainstream Innovation represented 25% of software revenue. SOLIDWORKS grew mid-single digits while CENTRIC PLM delivered double-digit growth. Year-to-date SOLIDWORKS performance has been impacted by China’s COVID-19 related shutdowns, which have lasted longer than expected.

  • Software Revenue by Industries: Life Sciences & Healthcare, Aerospace & Defense, Industrial Equipment, and Marine & Offshore displayed some of the strongest performance.

  • Key Strategic Drivers (IFRS and non-IFRS): 3DEXPERIENCE revenue increased 21% and represented 31% of software revenue. Cloud software revenue grew 22% and represented 22% of software revenue.

  • Operating Income and Margin: IFRS operating income increased 30%, as reported. Non-IFRS operating income rose 15% to €1,339.9 million, as reported. IFRS operating margin was 22.3% compared to 20.1% for the same period in 2021. The non-IFRS operating margin was 32.8% versus 33.3% in the comparable period last year. Throughout 2022 we have invested in future growth opportunities, as communicated early this year.

  • Earnings per Share: IFRS diluted earnings per share increased 12% to €0.46. Non-IFRS diluted EPS grew 19% to € 0.80, as reported.

  • Cash Flow from Operations (IFRS): Cash flow from operations totaled €1.281 billion, an increase of 2%, relative to the same period last year. The main changes result from tax cash flow differences related to the mandatory capitalization of R&D expenses for tax purposes in the USA and to withholding tax. Excluding those two effects, the cash flow from operations would have been up 10% year-to-date. Cash from operations was principally used for debt repayment, net of proceeds for €885 million, treasury shares buy-back and employee shareholding plan net of proceeds from stock options exercise for €359 million, and cash dividend payments for €224 million.”

  • Balance Sheet (IFRS): Dassault Systèmes’ net financial debt at September 30, 2022 decreased by €682 million to €208 million, compared to €889 million at December 31, 2021, reflecting cash, cash equivalents and short-term investments of €2.788 billion and debt related to borrowings of €2.996 billion at September 30, 2022.

Dassault Systèmes’ Chief Operating Officer Commentary

(revenue growth rates in constant currencies, data on a non-IFRS basis)

Pascal Daloz, Dassault Systèmes’ Chief Operating Officer, commented:

“In a challenging environment, we delivered a solid third quarter thanks to the resiliency of our model and the broad diversification of our business. In Industrial Innovation, our flagship brands CATIA, ENOVIA and DELMIA drove performance with strong, double-digit software revenue growth. In Life Sciences, MEDIDATA delivered excellent growth against a high comparison base, again this quarter. Mainstream Innovation rose mid-single digits as China's COVID related restrictions continued to be a headwind, impacting results this quarter, particularly for SOLIDWORKS.

The relevance and criticality of our platform and industry solution experiences have never been greater. To navigate today's complex economic and geopolitical environment, clients across all sectors of the economy continue to prioritize investments to accelerate sustainable innovation and increase resiliency and agility by optimizing production and logistics. This is well reflected in our strong customer adoption this quarter, incorporating numerous domains including precision medicine, modular nuclear reactors and connecting supply chains.

This quarter, we announced the acquisition of StyleSage, a cloud-based market intelligence platform offering retailers and brands AI-powered tools for competitive benchmarking, price optimization, and forecasting. StyleSage will bolster CENTRIC PLM’s value proposition by extending its footprint from collection management to business planning & analytics as well as e-commerce. We continue to innovate and invest for the future both organically and through M&A.”

Dassault Systèmes’ Chief Financial Officer Commentary

(revenue growth rates in constant currencies, data on a non-IFRS basis, cash flow IFRS)

Rouven Bergmann, Dassault Systèmes’ Chief Financial Officer, commented:

“We delivered solid results in the third quarter, demonstrating the strength of our model. Total revenue grew 8%, in line with our objectives. Recurring revenue growth accelerated, increasing 10%, and now represents 82% of software revenue, driven by strong subscription revenue, up 16%. This shows we are well prepared for a progressive acceleration in subscription growth while continuing to support our clients with optionality that meets their needs. Our key strategic drivers, 3DEXPERIENCE and cloud, continue to build momentum, increasing 15% and 21%, respectively.

Our third quarter earnings per share rose 17%, to €0.26, outperforming our objectives and reflecting a favorable US Dollar impact. We reported an operating margin of 31.6%, in line with our target range, while hiring nearly 800 net new team members during the quarter. Years of strategic investments in technology, infrastructure and our organization enable us to protect profitability while continuing to invest in advance of our clients' needs.

Turning to 2022, we are reaffirming our total revenue growth objective of 9-10% to a higher absolute range of €5.610-€5.650 from €5.485-€5.535 previously, incorporating the full benefit of currency. We are adjusting our recurring revenue growth target to 9-10%, from 9% previously, and our license growth target to 5-7%, from 9-11% previously. In addition, we are raising our 2022 diluted EPS objective to 18%-19% growth, reaching €1.12 to €1.14, keeping us on track to be fully deleveraged by year-end.”

Financial Objectives for 2022

Dassault Systèmes’ fourth quarter and full year 2022 financial objectives presented below are given on a non-IFRS basis and reflect the principal 2022 currency exchange rate assumptions for the US dollar and Japanese yen as well as the potential impact from additional non-Euro currencies:

    Q4 2022 FY 2022
Total Revenue (billion) €1.528 to €1.568 €5.610 to €5.650
Growth 12-15% 15-16%
Growth ex FX 8-10% 9-10%
       
Software revenue growth * 8-10% 9%
  Of which licenses and other software revenue growth * 2-7% 5-7%
  Of which recurring revenue growth * 10-11% 9-10%
Services revenue growth * 6-11% 11-12%
       
Operating Margin 34.9% – 35.9% 33.4% – 33.7%
       
EPS Diluted €0.32 - €0.34 €1.12 - €1.14
Growth 12-18% 18-19%
       
US dollar $1.05 per Euro $1.06 per Euro
Japanese yen (before hedging) JPY 139.0 per Euro JPY 136.7 per Euro
* Growth in Constant Currencies    

These objectives are prepared and communicated only on a non-IFRS basis and are subject to the cautionary statement set forth below.

The 2022 non-IFRS financial objectives set forth above do not take into account the following accounting elements below and are estimated based upon the 2022 principal currency exchange rates above: no significant contract liabilities write-downs; share-based compensation expenses, including related social charges, estimated at approximately €172.5 million (these estimates do not include any new stock option or share grants issued after September 30, 2022); amortization of acquired intangibles and of tangibles reevaluation, estimated at approximately €400.5 million, largely impacted by the acquisition of Medidata; and lease incentives of acquired companies at approximately €3.0 million.

The above objectives also do not include any impact from other operating income and expenses, net principally comprised of acquisition, integration and restructuring expenses, and impairment of goodwill and acquired intangible assets; from one-time items included in financial revenue; from one-time tax effects; and from the income tax effects of these non-IFRS adjustments. Finally, these estimates do not include any new acquisitions or restructuring completed after September 30, 2022.

Mergers & Acquisitions

Dassault Systemes Acquires StyleSage, Cloud-Based Market Intelligence Platform to Enhance CENTRIC PLM's Offering: New York-based StyleSage's proprietary, cloud-native platform provides retailers with AI-powered competitive assortment benchmarking, price optimization, and trend forecasting. StyleSage's leading technology and AI expertise in image recognition compliment CENTRIC PLMs offering, adding real-world evidence capture and insight generation. This will provide CENTRIC PLM clients compelling end-to-end solutions, enable price improvement, margin and profit visibility as well as optimization across the organization. StyleStage also brings strong leadership and talent to the CENTRIC PLM team.

Corporate Announcements

Today’s Webcast and Conference Call Information

Today, Wednesday, October 26, 2022, Dassault Systèmes will host, from London, a webcasted presentation at 9:00 AM London Time/ 10:00 AM Paris time, and will then host a conference call at 9:00 AM New York time / 2:00 PM London time / 3:00 PM Paris time. The webcasted presentation and conference calls will be available online by accessing investor.3ds.com.

Additional investor information is available at investor.3ds.com or by calling Dassault Systèmes’ Investor Relations at +33.1.61.62.69.24.

Investor Relations Events

  • Fourth Quarter 2022 Earnings Release: February 2, 2023
  • First Quarter 2023 Earnings Release: April 26, 2023
  • Second Quarter 2023 Earnings Release: July 25, 2023
  • Third Quarter 2023 Earnings Release: October 25, 2023

Forward-looking Information

Statements herein that are not historical facts but express expectations or objectives for the future, including but not limited to statements regarding the Group’s non-IFRS financial performance objectives are forward-looking statements. Such forward-looking statements are based on Dassault Systèmes management's current views and assumptions and involve known and unknown risks and uncertainties. Actual results or performances may differ materially from those in such statements due to a range of factors.

The Group’s actual results or performance may be materially negatively affected by numerous risks and uncertainties, as described in the “Risk Factors” section 1.9 of the 2021 Universal Registration Document (‘Document d'enregistrement universel’) filed with the AMF (French Financial Markets Authority) on March 17, 2022, available on the Group’s website www.3ds.com.

In particular, please refer to the risk factor “Uncertain Global Economic Environment” in section 1.9.1.1 of the 2021 Universal Registration Document set out below for ease of reference:

“In light of the uncertainties regarding economic, business, social, health and geopolitical conditions at the global level, Dassault Systèmes’ revenue, net earnings and cash flows may grow more slowly, whether on an annual or quarterly basis, mainly due to the following factors:

  • the deployment of Dassault Systèmes’ solutions may represent a large portion of a customer’s investments in software technology. Decisions to make such an investment are impacted by the economic environment in which the customers operate. Uncertain global geopolitical, economic and health conditions and the lack of visibility or the lack of financial resources may cause some customers, e.g. within automotive, aerospace or natural resources industries, to reduce, postpone or terminate their investments, or to reduce or not renew ongoing paid maintenance for their installed base, which impact larger customers’ revenue with their respective sub-contractors;

  • the political, economic and monetary situation in certain geographic regions where Dassault Systèmes operates could become more volatile and impact Dassault Systèmes’ business, for example, due to stricter export compliance rules or the introduction of new customs tariffs;

  • continued pressure or volatility on raw materials and energy prices could also slow down Dassault Systèmes’ diversification efforts in new industries;
  • current inflation forecasts, as well as uncertainties regarding the extent and duration of this trend, could adversely affect the financial condition of Dassault Systèmes; and
  • the sales cycle of the Dassault Systèmes’ products – already relatively long due to the strategic nature of such investments for customers – could further lengthen.

The occurrence of crises – health and geopolitical crises in particular – could have consequences for the health and safety of Dassault Systèmes’ employees. It could also adversely impact the financial situation or financing capabilities of Dassault Systèmes’ existing and potential customers, commercial and technology partners, some of whom may be forced to temporarily close sites or cease operations. A deteriorating economic environment could generate increased price pressure and affect the collection of receivables, which would negatively impact Dassault Systèmes’ revenue, financial performance and market position.

Dassault Systèmes makes every effort to take into consideration this uncertain macroeconomic outlook. Dassault Systèmes’ business results, however, may not develop as anticipated. Furthermore, due to factors affecting sales of Dassault Systèmes’ products and services, there may be a substantial time lag between an improvement in global economic and business conditions and an upswing in the Company’s business results.”

In preparing such forward-looking statements, the Group has in particular assumed an average US dollar to euro exchange rate of US$1.05 per €1.00 as well as an average Japanese yen to euro exchange rate of JPY139.0 to €1.00, before hedging for the fourth quarter 2022. The Group has in particular assumed an average US dollar to euro exchange rate of US$1.06 per €1.00 as well as an average Japanese yen to euro exchange rate of JPY136.7 to €1.00, before hedging for the full year 2022. However, currency values fluctuate, and the Group’s results may be significantly affected by changes in exchange rates.

Non-IFRS Financial Information

Readers are cautioned that the supplemental non-IFRS financial information presented in this press release is subject to inherent limitations. It is not based on any comprehensive set of accounting rules or principles and should not be considered in isolation from or as a substitute for IFRS measurements. The supplemental non-IFRS financial information should be read only in conjunction with the Company’s consolidated financial statements prepared in accordance with IFRS. Furthermore, the Group’s supplemental non-IFRS financial information may not be comparable to similarly titled “non-IFRS” measures used by other companies. Specific limitations for individual non-IFRS measures are set forth in the Company’s 2021 Universal Registration Document filed with the AMF on March 17, 2022.

In the tables accompanying this press release the Group sets forth its supplemental non-IFRS figures for revenue, operating income, operating margin, net income and diluted earnings per share, which exclude the effect of adjusting the carrying value of acquired companies’ deferred revenue, share-based compensation expense and related social charges, the amortization of acquired intangible assets and of tangibles reevaluation, certain other operating income and expense, net, including impairment of goodwill and acquired intangibles, the effect of adjusting lease incentives of acquired companies, certain one-time items included in financial revenue and other, net, and the income tax effect of the non-IFRS adjustments and certain one-time tax effects. The tables also set forth the most comparable IFRS financial measure and reconciliations of this information with non-IFRS information.

FOR MORE INFORMATION

Dassault Systèmes’ 3DEXPERIENCE platform, 3D design software, 3D Digital Mock Up and Product Lifecycle Management (PLM) solutions: http://www.3ds.com


ABOUT DASSAULT SYSTÈMES

Dassault Systèmes, the 3DEXPERIENCE Company, is a catalyst for human progress. We provide business and people with collaborative 3D virtual environments to imagine sustainable innovations. By creating virtual twin experiences of the real world with our 3DEXPERIENCE platform and applications, our customers push the boundaries of innovation, learning and production to achieve a more sustainable world for patients, citizens, and consumers.  Dassault Systèmes brings value to more than 300,000 customers of all sizes, in all industries, in more than 140 countries. For more information, visit www.3ds.com

Dassault Systèmes Investor Relations Team                FTI Consulting

Béatrix Martinez / François-José Bordonado:                Arnaud de Cheffontaines: +33 1 47 03 69 48

+33 1 61 62 40 73 / 69 24                                Jamie Ricketts : +44 20 3727 1600

investors@3ds.com                                        Tom Blundell: +44 20 3727 1600

USA & Canada: callie.gauzer@3ds.com

Dassault Systèmes Press Contacts

Arnaud Malherbe

+33 (0)1 61 62 87 73

arnaud.malherbe@3ds.com        

© Dassault Systèmes. All rights reserved. 3DEXPERIENCE, the Compass icon, the 3DS logo, CATIA, BIOVIA, GEOVIA, SOLIDWORKS, 3DVIA, ENOVIA, NETVIBES, MEDIDATA, CENTRIC PLM, 3DEXCITE, SIMULIA, DELMIA, and IFWE are commercial trademarks or registered trademarks of Dassault Systèmes, a French “société européenne” (Versailles Commercial Register # B 322 306 440), or its subsidiaries in the United States and/or other countries.

APPENDIX TABLE OF CONTENTS

Due to rounding, numbers presented throughout this and other documents may not add up precisely to the totals provided and percentages may not precisely reflect the absolute figures.    

Glossary of Definitions

Non-IFRS Financial Information

Acquisitions and Foreign Exchange Impact

Condensed consolidated statements of income

Condensed consolidated balance sheet

Condensed consolidated cash flow statement

IFRS – non-IFRS reconciliation

DASSAULT SYSTÈMES - Glossary of Definitions

Information in Constant Currencies

Dassault Systèmes have followed a long-standing policy of measuring our revenue performance and setting our revenue objectives exclusive of currency in order to measure in a transparent manner the underlying level of improvement in our total revenue and software revenue by activity, industry, geography and product lines. We believe it is helpful to evaluate our growth exclusive of currency impacts, particularly to help understand revenue trends in our business. Therefore, we provide percentage increases or decreases in our revenue and expenses (in both IFRS as well as non-IFRS) to eliminate the effect of changes in currency values, particularly the U.S. dollar and the Japanese yen, relative to the euro. When trend information is expressed by us “in constant currencies”, the results of the “prior” period have first been recalculated using the average exchange rates of the comparable period in the current year, and then compared with the results of the comparable period in the current year.

While constant currency calculations are not considered to be an IFRS measure, we do believe these measures are critical to understanding our global revenue results and to compare with many of our competitors who report their financial results in U.S. dollars. Therefore, we are including this calculation for comparing IFRS revenue figures for comparable periods as well as for comparing non-IFRS revenue figures for comparable periods. All information at constant exchange rates are expressed as a rounded percentage and therefore may not precisely reflect the absolute figures.

Information on Growth excluding acquisitions (“organic growth”)

In addition to financial indicators on the entire Group’s scope, Dassault Systèmes provides growth excluding acquisitions effect, also named organic growth. In order to do so, the data relating to the scope is restated excluding acquisitions, from the date of the transaction, over a period of 12 months.

Information on Industrial Sectors

Dassault Systèmes’ Industries develop Solution Experiences, industry-focused offerings that deliver specific value to companies and users in a particular industry. We serve eleven industries structured into three sectors:

  • Manufacturing industries Sector: Transportation & Mobility; Aerospace & Defense; Marine & Offshore; Industrial Equipment; High-Tech; Home & Lifestyle; Consumer Packaged Goods & Retail;
  • Life Sciences & Healthcare Sector: Life Sciences & Healthcare;
  • Infrastructure & Cities Sector: Infrastructure, Energy & Materials; Architecture, Engineering & Construction; Cities, Public & Business Services.

Information on Product Lines

Our product lines financial reporting include the following financial information:

  • Industrial Innovation software revenue, comprised of our CATIA, ENOVIA, SIMULIA, DELMIA, GEOVIA, NETVIBES, and 3DEXCITE brands;
  • Life Sciences software revenue, comprised of our MEDIDATA and BIOVIA brands;
  • Mainstream Innovation software revenue, comprised of our CENTRIC PLM and 3DVIA brands, as well as our 3DEXPERIENCE WORKS family which includes the SOLIDWORKS brand.

3DEXPERIENCE Licenses and Software Contribution

To measure the progressive penetration of 3DEXPERIENCE software, we utilize the following ratios:

  • for Licenses revenue, we calculate the percentage contribution by comparing total 3DEXPERIENCE Licenses revenue to Licenses revenue for all product lines except SOLIDWORKS and acquisitions (“related Licenses revenue”);
  • for software revenue, the Group calculates the percentage contribution by comparing total 3DEXPERIENCE software revenue to software revenue for all product lines except SOLIDWORKS and acquisitions (“related software revenue”).

Cloud Revenue

Cloud revenues correspond to revenue generated through a catalog of online services delivered by Dassault Systèmes via a cloud infrastructure hosted by Dassault Systèmes, or by third party providers of cloud computing infrastructure services. This offering is available through different deployment methods: Public cloud, Private cloud, Dedicated cloud. All cloud applications can be offered through perpetual licenses and maintenance or subscriptions models.

DASSAULT SYSTÈMES

NON-IFRS FINANCIAL INFORMATION

(unaudited; in millions of Euros, except per share data, percentages, headcount and exchange rates)

Non-IFRS key figures exclude the effects of adjusting the carrying value of acquired companies’ contract liabilities (deferred revenue), share-based compensation expense, including related social charges, amortization of acquired intangible assets and of tangible assets revaluation, lease incentives of acquired companies, other operating income and expense, net, including the acquisition, integration and restructuring expenses, and impairment of goodwill and acquired intangible assets, certain one-time items included in financial loss, net, certain one-time tax effects and the income tax effects of these non-IFRS adjustments.

Comparable IFRS financial information and a reconciliation of the IFRS and non-IFRS measures are set forth in the separate tables within this Attachment.

In millions of Euros, except per share data, percentages, headcount and exchange rates


Non-IFRS reported
Three months ended Nine months ended
September 30,

2022
September 30,

2021
Change Change in constant currencies September 30,

2022
September 30,

2021
Change Change in constant currencies
Total Revenue € 1,373.0 € 1,158.8 18% 8% € 4,081.6 € 3,493.9 17% 9%
                 
Revenue breakdown by activity                
Software revenue 1,229.9 1,044.7 18% 8% 3,685.6 3,164.4 16% 9%
Of which licenses and other software revenue 221.3 208.3 6% (2)% 727.5 635.2 15% 7%
Of which subscription and support revenue 1,008.6 836.4 21% 10% 2,958.1 2,529.2 17% 9%
Services revenue 143.1 114.1 26% 16% 396.0 329.5 20% 13%
                 
Software revenue breakdown by product line                
Industrial Innovation 623.5 555.3 12% 6% 1,940.2 1,735.6 12% 7%
Life Sciences 294.6 226.5 30% 13% 823.8 654.7 26% 13%
Mainstream Innovation 311.7 262.9 19% 5% 921.7 774.1 19% 8%
                 
Software Revenue breakdown by geography                
Americas 510.0 401.9 27% 7% 1,483.1 1,219.8 22% 8%
Europe 421.2 370.7 14% 9% 1,281.2 1,135.4 13% 9%
Asia 298.7 272.2 10% 6% 921.4 809.2 14% 11%
                 
Operating income € 433.5 € 392.1 11%   € 1,339.9 € 1,163.3 15%  
Operating margin 31.6% 33.8%     32.8% 33.3%    
                 
Net income attributable to shareholders € 347.0 € 296.5 17%   € 1,056.3 € 885.1 19%  
Diluted earnings per share (1) € 0.26 € 0.22 17% 6% € 0.80 € 0.67 19% 11%
                 
Closing headcount 24,162 21,991 10%   24,162 21,991 10%  
                 
Average Rate USD per Euro 1.01 1.18 (15)%   1.06 1.20 (11)%  
Average Rate JPY per Euro 139.16 129.76 7%   135.97 129.83 5%  

(1) 2021 and 2022 figures have been presented in order to reflect the five-for-one share split on Dassault Systèmes’ share effected on July 7, 2021

DASSAULT SYSTÈMES

ACQUISITIONS AND FOREIGN EXCHANGE IMPACT

(unaudited; in millions of Euros)

In millions of Euros

Non-IFRS reported o/w growth at constant rate and scope

o/w change of scope impact at current year rate

o/w FX impact on previous year figures

September 30,

2022
September 30,

2021
Change
Revenue QTD 1,373.0 1,158.8 214.2 104.2 1.0 109.0
Revenue YTD 4,081.6 3,493.9 587.8 342.1 1.5 244.2


DASSAULT SYSTÈMES

CONDENSED CONSOLIDATED STATEMENTS OF INCOME

(unaudited; in millions of Euros, except per share data and percentages)

In millions of Euros, except per share data and percentages


IFRS reported
Three months ended Nine months ended
September 30, September 30, September 30, September 30,
2022 2021 2022 2021
Licenses and other software revenue 221.3 208.3 727.5 635.2
Subscription and Support revenue 1,008.5 836.3 2,957.9 2,527.9
Software revenue 1,229.8 1,044.6 3,685.4 3,163.1
Services revenue 143.1 114.1 396.0 329.2
Total Revenue € 1,373.0 € 1,158.7 € 4,081.4 € 3,492.4
Cost of software revenue (1) (116.5) (100.1) (340.6) (297.8)
Cost of services revenue (115.6) (92.2) (331.8) (285.6)
Research and development expenses (287.2) (233.8) (805.6) (700.2)
Marketing and sales expenses (372.3) (303.5) (1,077.9) (922.9)
General and administrative expenses (105.0) (93.7) (304.6) (283.5)
Amortization of acquired intangible assets and of tangible assets revaluation (103.9) (95.2) (299.5) (273.9)
Other operating income and expense, net (7.8) (3.2) (10.5) (27.3)
Total Operating Expenses (1,108.3)                     (921.7) (3,170.4) (2,791.2)
Operating Income € 264.7 € 237.0 € 911.0 € 701.1
Financial income (loss), net 2.4 (4.7) (7.3) (12.6)
Income before income taxes € 267.1 € 232.3 € 903.7 € 688.5
Income tax expense (53.0) (52.3) (302.0) (151.9)
Net Income € 214.1 € 180.1 € 601.7 € 536.6
Non-controlling interest 0.4 (0.5) 1.1 0.0
Net Income attributable to equity holders of the parent € 214.5 € 179.5 € 602.9 € 536.6
Basic earnings per share (2) 0.16 0.14 0.46 0.41
Diluted earnings per share (2) € 0.16 € 0.14 € 0.46 € 0.41
Basic weighted average shares outstanding (in millions) 1,313.9 1,313.4 1,311.8 1,309.7
Diluted weighted average shares outstanding (in millions) 1,322.0 1,325.4 1,323.7 1,324.3

(1) Excluding amortization of acquired intangible assets and of tangible assets revaluation

                        (2) 2021 and 2022 figures have been presented in order to reflect the five-for-one share split on Dassault Systèmes’ share effected on July 7, 2021

IFRS reported


Three months ended September 30, 2022 Nine months ended September 30, 2022
Change (3) Change in constant currencies Change (3) Change in constant currencies
Total Revenue 18% 8% 17% 9%
Revenue by activity        
Software revenue 18% 8% 17% 9%
Services revenue 26% 16% 20% 13%
Software Revenue by product line        
Industrial Innovation 12% 6% 12% 7%
Life Sciences 30% 14% 26% 14%
Mainstream Innovation 19% 5% 19% 8%
Software Revenue by geography        
Americas 27% 7% 22% 8%
Europe 14% 9% 13% 9%
Asia 10% 6% 14% 11%

(3) Variation compared to the same period in the prior year

DASSAULT SYSTÈMES

CONDENSED CONSOLIDATED BALANCE SHEET

(unaudited; in millions of Euros)

In millions of Euros


IFRS reported
September 30, December 31,
2022 2021
ASSETS    
Cash and cash equivalents 2,787.5 2,979.5
Trade accounts receivable, net 1,179.5 1,366.3
Contract assets 24.3 12.7
Other current assets 518.1 360.5
Total current assets 4,509.3 4,719.0
Property and equipment, net 850.0 817.0
Goodwill and Intangible assets, net 9,030.3 8,175.0
Other non-current assets 314.8 507.7
Total non-current assets 10,195.1 9,499.7
Total Assets € 14,704.5 € 14,218.7
LIABILITIES AND EQUITY    
Trade accounts payable 209.1 192.4
Contract liabilities 1,454.7 1,304.4
Borrowings, current 253.7 903.3
Other current liabilities 698.3 1,070.3
Total current liabilities 2,615.8 3,470.3
Borrowings, non-current 2,741.8 2,966.4
Other non-current liabilities 1,521.7 1,571.0
Total non-current liabilities 4,263.5 4,537.4
Non-controlling interests 14.7 13.7
Parent shareholders' equity 7,810.6 6,197.3
Total Liabilities and equity € 14,704.5 € 14,218.7

DASSAULT SYSTÈMES

CONDENSED CONSOLIDATED CASH FLOW STATEMENT

(unaudited; in millions of Euros)

In millions of Euros


IFRS reported
Three months ended Nine months ended
September 30, September 30, Change


September 30, September 30, Change


2022 2021 2022 2021
Net income attributable to equity holders of the parent 214.5 179.5 35.0 602.9 536.6 66.3
Non-controlling interest (0.4) 0.5 (0.9) (1.1) 0.0 (1.1)
Net income 214.1 180.1 34.0 601.7 536.6 65.1
Depreciation of property and equipment 46.2 43.4 2.8 139.4 130.4 9.0
Amortization of intangible assets 106.1 96.5 9.6 307.6 283.1 24.5
Adjustments for other non-cash items 28.5 25.2 3.3 225.2 104.4 120.8
Changes in working capital (162.1) (129.0) (33.1) 6.6 194.9 (188.3)
Net Cash Provided by (Used in) Operating Activities € 232.8 € 216.1 € 16.7 € 1,280.6 € 1,249.4 € 31.2
             
Additions to property, equipment and intangibles assets (43.3) (17.0) (26.3) (106.0) (73.7) (32.3)
Payment for acquisition of businesses, net of cash acquired (5.4) (7.4) 2.0 (12.7) (7.4) (5.3)
Other (1.2) (2.6) 1.4 (30.5) (11.8) (18.7)
Net Cash Provided by (Used in) Investing Activities € (49.8) € (26.9) € (22.9) € (149.1) € (92.9) (56.2)
             
Proceeds from exercise of stock options 23.5 47.9 (24.4) 49.2 122.8 (73.6)
Cash dividends paid - - - (223.5) (147.1) (76.4)
Repurchase and sale of treasury stock (4.0) (161.9) 157.9 (606.5) (256.3) (350.2)
Capital increase - - - 198.6 - 198.6
Acquisition of non-controlling interests (0.1) (0.1) - (0.6) (0.1) (0.5)
Proceeds from borrowings 252.1 1.3 250.8 255.8 1.3 254.5
Repayment of borrowings (902.2) (329.3) (572.9) (1,140.5) (340.5) (800.0)
Repayment of lease liabilities (24.6) (24.0) (0.6) (74.4) (73.2) (1.2)
Net Cash Provided by (Used in) Financing Activities € (655.3) € (466.1) € (189.2) € (1,541.9) € (693.1) € (848.8)
             
Effect of exchange rate changes on cash and cash equivalents 102.7 28.3 74.4 218.4 58.2 160.2
             
Increase (decrease) in cash and cash equivalents € (369.6) € (248.6) € (121.0) € (192.0) € 521.5 € (713.5)
             
Cash and cash equivalents at beginning of period € 3,157.0 € 2,919.0   € 2,979.5 € 2,148.9  
Cash and cash equivalents at end of period € 2,787.5 € 2,670.4   € 2,787.5 € 2,670.4  

DASSAULT SYSTÈMES

SUPPLEMENTAL NON-IFRS FINANCIAL INFORMATION

IFRS – NON-IFRS RECONCILIATION

(unaudited; in millions of Euros, except per share data and percentages)

Readers are cautioned that the supplemental non-IFRS information presented in this press release is subject to inherent limitations. It is not based on any comprehensive set of accounting rules or principles and should not be considered as a substitute for IFRS measurements. Also, the Group’s supplemental non-IFRS financial information may not be comparable to similarly titled “non-IFRS” measures used by other companies. Further specific limitations for individual non-IFRS measures, and the reasons for presenting non-IFRS financial information, are set forth in the Group’s Document d’Enregistrement Universel for the year ended December 31, 2021 filed with the AMF on March 17, 2022. To compensate for these limitations, the supplemental non-IFRS financial information should be read not in isolation, but only in conjunction with the Group’s consolidated financial statements prepared in accordance with IFRS.

In millions of Euros, except per share data and percentages


Three months ended September 30, Change
2022 Adjustment(1)

2022 2021 Adjustment(1)

2021 IFRS

Non-IFRS(2)

IFRS Non-IFRS IFRS Non-IFRS
Total Revenue € 1,373.0 € 0.1 € 1,373.0 € 1,158.7 € 0.1 € 1,158.8 18% 18%
Revenue breakdown by activity                
Software revenue 1,229.8 0.1 1,229.9 1,044.6 0.1 1,044.7 18% 18%
Licenses and other software revenue 221.3 - 221.3 208.3 - 208.3 6% 6%
Subscription and Support revenue 1,008.5 0.1 1,008.6 836.3 0.1 836.4 21% 21%
Recurring portion of Software revenue 82%   82% 80%   80%    
Services revenue 143.1 - 143.1 114.1 - 114.1 26% 26%
Software Revenue breakdown by product line                
Industrial Innovation 623.5 - 623.5 555.3 - 555.3 12% 12%
Life Sciences 294.6 - 294.6 226.5 - 226.5 30% 30%
Mainstream Innovation 311.7 0.1 311.7 262.9 0.1 262.9 19% 19%
Software Revenue breakdown by geography                
Americas 510.0 - 510.0 401.9 0.1 401.9 27% 27%
Europe 421.2 - 421.2 370.6 0.0 370.7 14% 14%
Asia 298.7 - 298.7 272.2 - 272.2 10% 10%
Total Operating Expenses € (1,108.3) € 168.8 (939.5) € (921.7) € 155.0 € (766.7) 20% 23%
Share-based compensation expense and related social charges (56.3) 56.3 - (56.0) 56.0 -    
Amortization of acquired intangible assets and of tangible assets revaluation (103.9) 103.9 - (95.2) 95.2 -    
Lease incentives of acquired companies (0.8) 0.8 - (0.7) 0.7 -    
Other operating income and expense, net (7.8) 7.8 - (3.2) 3.2 -    
Operating Income € 264.7 € 168.8 € 433.5 € 237.0 € 155.1 € 392.1 12% 11%
Operating Margin 19.3%   31.6% 20.5%   33.8%    
Financial income (loss), net 2.4 1.5 3.9 (4.7) 0.4 (4.2) (152)% (193)%
Income tax expense (53.0) (37.5) (90.5) (52.3) (37.7) (89.9) 1% 1%
Non-controlling interest 0.4 (0.4) 0.1 (0.5) (0.9) (1.5) (181)% (105)%
Net Income attributable to shareholders € 214.5 € 132.5 € 347.0 € 179.5 € 116.9 € 296.5 20% 17%
Diluted Earnings Per Share (3) € 0.16 € 0.10 € 0.26 € 0.14 € 0.09 € 0.22 20% 17%

      (1)   In the reconciliation schedule above, (i) all adjustments to IFRS revenue data reflect the exclusion of the effect of adjusting the carrying value of acquired companies’ contract liabilities (deferred revenue); (ii) adjustments to IFRS operating expense data reflect the exclusion of the amortization of acquired intangible assets and of tangible assets revaluation, share-based compensation expense, including related social charges, lease incentives of acquired companies, as detailed below, and other operating income and expense, net including acquisition, integration and restructuring expenses, and impairment of goodwill and acquired intangible assets; (iii) adjustments to IFRS financial loss, net reflect the exclusion of certain one-time items included in financial loss, net, and; (iv) all adjustments to IFRS income data reflect the combined effect of these adjustments, plus with respect to net income and diluted earnings per share, certain one-time tax effects and the income tax effect of the non-IFRS adjustments.

In millions of Euros, except percentages

Three months ended September 30, Change
2022

IFRS
Share-based compensation expense and related social charges Lease incentives of acquired companies 2022

Non-IFRS
2021

IFRS
Share-based compensation expense and related social charges Lease incentives of acquired companies 2021

Non-IFRS
IFRS Non-

IFRS
Cost of revenue (232.0) 2.8 0.2 (229.0) (192.3) 3.2 0.2 (188.9) 21% 21%
Research and development expenses (287.2) 22.0 0.3 (264.8) (233.8) 21.2 0.3 (212.3) 23% 25%
Marketing and sales expenses (372.3) 15.3 0.1 (356.9) (303.5) 17.1 0.1 (286.3) 23% 25%
General and administrative expenses (105.0) 16.1 0.1 (88.9) (93.7) 14.5 0.1 (79.1) 12% 12%
Total   € 56.3 € 0.8     € 56.0 € 0.7      

(2) The non-IFRS percentage increase (decrease) compares non-IFRS measures for the two different periods. In the event there is non-IFRS adjustment to the relevant measure for only one of the periods under comparison, the non-IFRS increase (decrease) compares the non-IFRS measure to the relevant IFRS measure.

(3) Based on a weighted average 1,322.0 million diluted shares for Q3 2022 and 1,325.4 million diluted shares for Q3 2021. 2021 and 2022 figures have been presented in order to reflect the five-for-one share split on Dassault Systèmes’ share effected on July 7, 2021

DASSAULT SYSTÈMES

SUPPLEMENTAL NON-IFRS FINANCIAL INFORMATION

IFRS – NON-IFRS RECONCILIATION

(unaudited; in millions of Euros, except per share data and percentages)

Readers are cautioned that the supplemental non-IFRS information presented in this press release is subject to inherent limitations. It is not based on any comprehensive set of accounting rules or principles and should not be considered as a substitute for IFRS measurements. Also, the Group’s supplemental non-IFRS financial information may not be comparable to similarly titled “non-IFRS” measures used by other companies. Further specific limitations for individual non-IFRS measures, and the reasons for presenting non-IFRS financial information, are set forth in the Group’s Document d’Enregistrement Universel for the year ended December 31, 2021 filed with the AMF on March 17, 2022. To compensate for these limitations, the supplemental non-IFRS financial information should be read not in isolation, but only in conjunction with the Group’s consolidated financial statements prepared in accordance with IFRS.

In millions of Euros, except per share data and percentages


Nine months ended September 30, Change
2022 Adjustment(1)

2022 2021 Adjustment(1)

2021 IFRS

Non-IFRS(2)

IFRS Non-IFRS IFRS Non-IFRS
Total Revenue € 4,081.4 € 0.2 € 4,081.6 € 3,492.4 € 1.5 € 3,493.9 17% 17%
Revenue breakdown by activity                
Software revenue 3,685.4 0.2 3,685.6 3,163.1 1.3 3,164.4 17% 16%
Licenses and other software revenue 727.5 - 727.5 635.2 - 635.2 15% 15%
Subscription and Support revenue 2,957.9 0.2 2,958.1 2,527.9 1.3 2,529.2 17% 17%
Recurring portion of Software revenue 80%   80% 80%   80%    
Services revenue 396.0 - 396.0 329.2 0.2 329.5 20% 20%
Software Revenue breakdown by product line                
Industrial Innovation 1,940.2 - 1,940.2 1,735.6 - 1,735.6 12% 12%
Life Sciences 823.8 - 823.8 653.7 1.0 654.7 26% 26%
Mainstream Innovation 921.5 0.2 921.7 773.8 0.3 774.1 19% 19%
Software Revenue breakdown by geography                
Americas 1,483.0 0.1 1,483.1 1,218.7 1.1 1,219.8 22% 22%
Europe 1,281.1 0.1 1,281.2 1,135.3 0.1 1,135.4 13% 13%
Asia 921.4 - 921.4 809.2 - 809.2 14% 14%
Total Operating Expenses € (3,170.4) € 428.6 € (2,741.7) € (2,791.2) € 460.7 € (2,330.5) 14% 18%
Share-based compensation expense and related social charges (116.4) 116.4 - (157.4) 157.4 -    
Amortization of acquired intangible assets and of tangible assets revaluation (299.5) 299.5 - (273.9) 273.9 -    
Lease incentives of acquired companies (2.2) 2.2 - (2.1) 2.1 -    
Other operating income and expense, net (10.5) 10.5 - (27.3) 27.3 -    
Operating Income € 911.0 € 428.9 € 1,339.9 € 701.1 € 462.2 € 1,163.3 30% 15%
Operating Margin 22.3%   32.8% 20.1%   33.3%    
Financial income (loss), net (7.3) 2.2 (5.0) (12.6) 1.2 (11.4) (42)% (56)%
Income tax expense (302.0) 23.3 (278.8) (151.9) (111.3) (263.2) 99% 6%
Non-controlling interest 1.1 (0.9) 0.2 0.0 (3.6) (3.6) N/A (106)%
Net Income attributable to shareholders € 602.9 € 453.4 € 1,056.3 € 536.6 € 348.5 € 885.1 12% 19%
Diluted Earnings Per Share (3) € 0.46 € 0.34 € 0.80 € 0.41 € 0.26 € 0.67 12% 19%

(1) In the reconciliation schedule above, (i) all adjustments to IFRS revenue data reflect the exclusion of the effect of adjusting the carrying value of acquired companies’ contract liabilities (deferred revenue); (ii) adjustments to IFRS operating expense data reflect the exclusion of the amortization of acquired intangible assets and of tangible assets revaluation, share-based compensation expense, including related social charges, lease incentives of acquired companies, as detailed below, and other operating income and expense, net including acquisition, integration and restructuring expenses, and impairment of goodwill and acquired intangible assets; (iii) adjustments to IFRS financial loss, net reflect the exclusion of certain one-time items included in financial loss, net, and; (iv) all adjustments to IFRS income data reflect the combined effect of these adjustments, plus with respect to net income and diluted earnings per share, certain one-time tax effects and the income tax effect of the non-IFRS adjustments.

In millions of Euros, except percentages

Nine months ended September 30, Change
2022

IFRS
Share-based compensation expense and related social charges Lease incentives of acquired companies 2022

Non-IFRS
2021

IFRS
Share-based compensation expense and related social charges Lease incentives of acquired companies 2021

Non-IFRS
IFRS Non-

IFRS
Cost of revenue (672.4) 6.1 0.7 (665.6) (583.4) 10.1 0.6 (572.7) 15% 16%
Research and development expenses (805.6) 43.0 0.9 (761.6) (700.2) 55.3 0.9 (644.0) 15% 18%
Marketing and sales expenses (1,077.9) 33.3 0.4 (1,044.2) (922.9) 45.0 0.3 (877.6) 17% 19%
General and administrative expenses (304.6) 34.0 0.3 (270.3) (283.5) 47.0 0.2 (236.3) 7% 14%
Total   € 116.4 € 2.2     € 157.4 € 2.1      

(2) The non-IFRS percentage increase (decrease) compares non-IFRS measures for the two different periods. In the event there is non-IFRS adjustment to the relevant measure for only one of the periods under comparison, the non-IFRS increase (decrease) compares the non-IFRS measure to the relevant IFRS measure.

(3) Based on a weighted average 1,323.7 million diluted shares for YTD 2022 and 1,324.3 million diluted shares for YTD 2021. 2021 and 2022 figures have been presented in order to reflect the five-for-one share split on Dassault Systèmes’ share effected on July 7, 2021

2 306 440), or its subsidiaries in the United States and/or other countries.


Attachment


Via GlobeNewswire RSS Feed https://ift.tt/62mghIB

Market Reports

Market Report & Surveys
IndianWeb2.com © all rights reserved